Sample stock count report for a company
A 5-page PDF sample of a stock count report: differences in goods and fixed assets, causes, actions and signatures. All data are conditional.
Sample: the data is conditional, this is not a real client report.
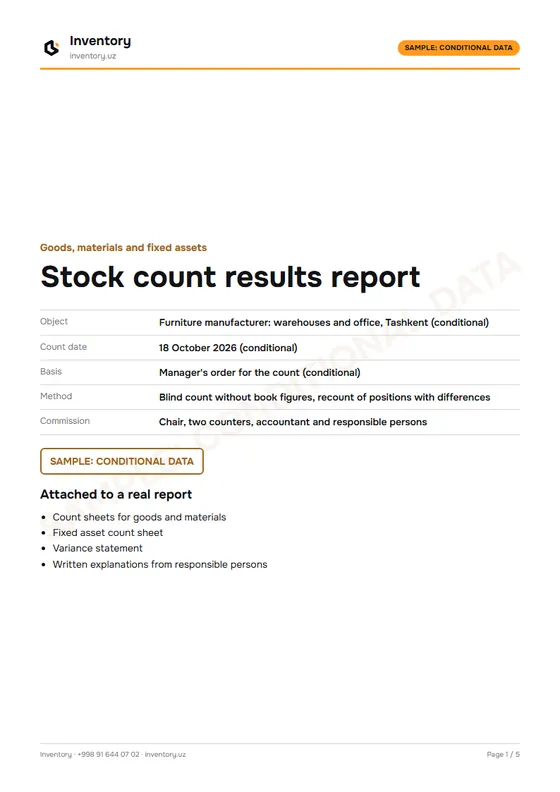 CoverObject, count date, method and commission. The stamp reminds the reader that all data are conditional.
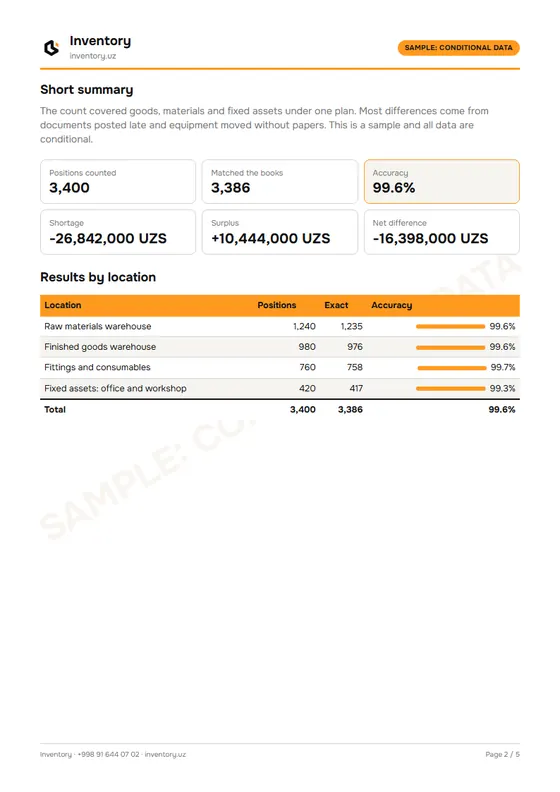 SummaryKey indicators and results by location on one page, for a quick read by the manager.
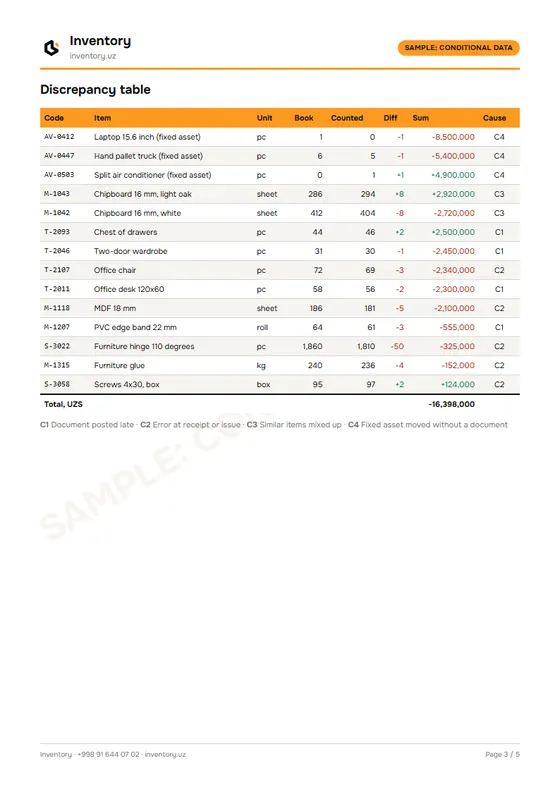 DiscrepanciesBook and counted quantities, difference and sum, with goods and fixed assets in one table.
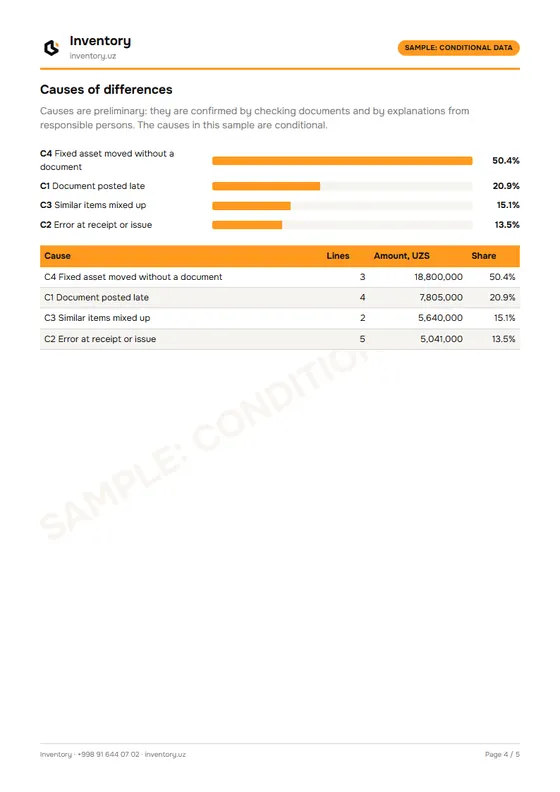 CausesDifferences are grouped into four causes, so the reader sees what stands behind the numbers.
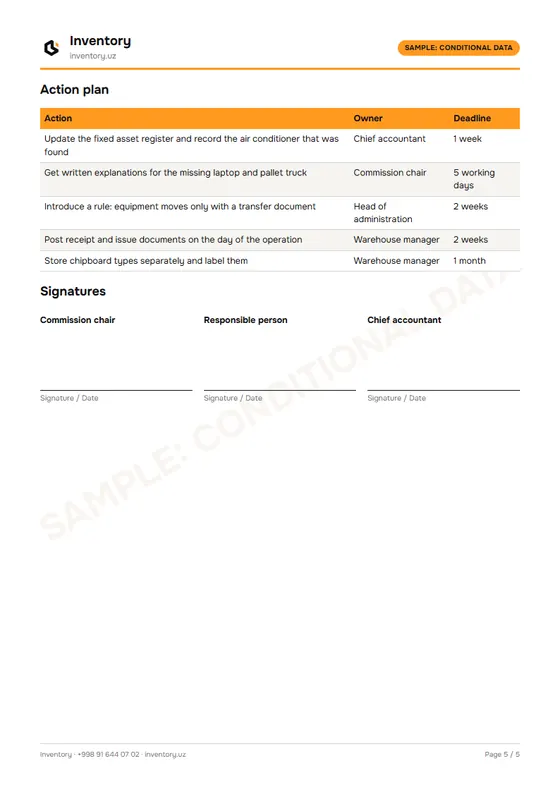 Actions and signaturesWho does what and by when, the commission's signatures and the list of attached documents.
What is in the report
This sample shows how a stock count report for goods, materials and fixed assets can be built. All figures and the object are conditional and do not belong to any real company. Five pages take the reader from the count details to the decisions:
- Cover: object, date, method and commission.
- Summary: positions counted, accuracy, shortages and surpluses, results by location.
- Discrepancies: book and counted quantities, difference and sum, line by line.
- Causes and actions: why the differences appeared, who fixes what and by when, then the signatures.
How each reader uses it
The manager reads the summary and the action table: where control is weak, who is responsible and what decision is needed. The accountant works from the discrepancy table: which shortages and surpluses go into the books, who must give a written explanation, and which fixed asset must be added to the register or corrected. An auditor looks at the method, the signatures and the list of appendices: can the count be relied on as evidence, and can each figure be traced back to the count sheets?
Read how such a document is prepared in the article on the structure of a contractor's report. To check your own control first, take the shortage risk test.
FAQ
Is this a real report?
No, it is a sample. The company, figures, dates and prices are conditional and are there only to show the structure of a report. A real report has your site's data, signatures and figures from the count sheets.
Why are goods and fixed assets in one table?
Companies often check both in the same count, and a manager needs the whole picture. In the sample they differ by code. In real work fixed assets get a separate count sheet, and the report brings the results together.
Is a signed act not enough?
An act and a variance statement record the differences. A report explains them: where they arose, why, and what to do next. For a manager's decision it is this explanation and the action table with owners and deadlines that help.